> ## Documentation Index
> Fetch the complete documentation index at: https://help.polygon-one.com/llms.txt
> Use this file to discover all available pages before exploring further.
# Map
> Map view for geodata and production locations
## Overview
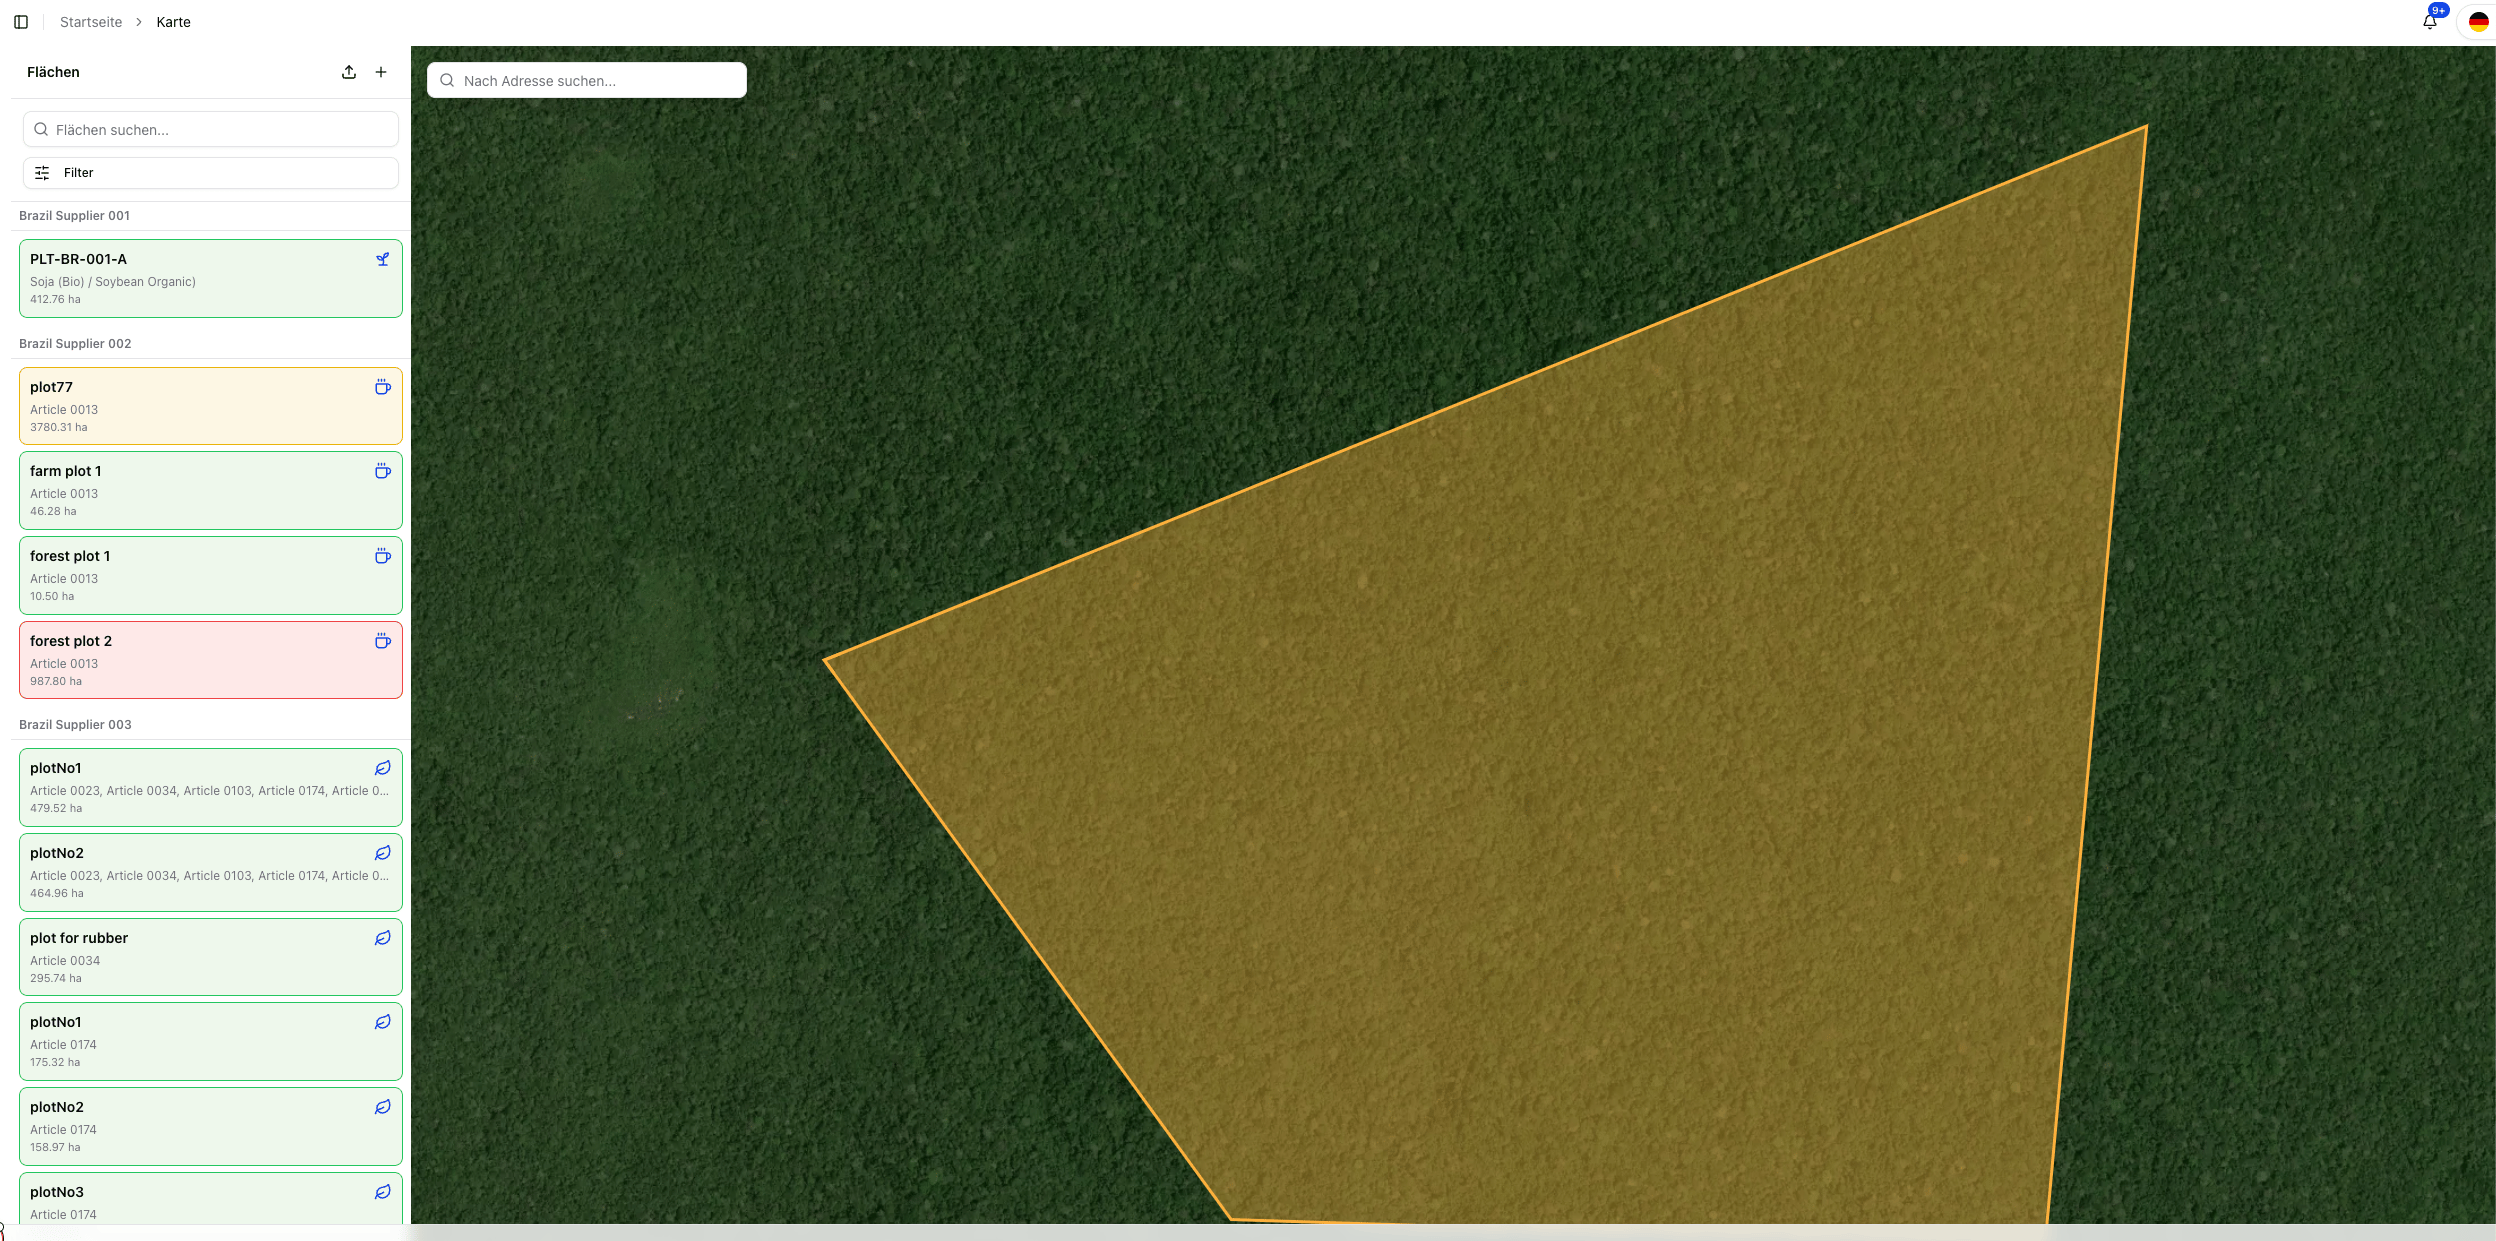
The **map view** provides a global overview of all production areas captured in Polygon One. It complements the [plot view](/en/eudr/optional/plots) with a geographic perspective and is particularly useful after import, analysis, or risk review.
 ## Filters
Using the filter bar, you can narrow down the displayed areas:
| Filter | Description |
| ------------------- | -------------------------------------------------------------- |
| **Status** | Filter by compliance status (e.g. only areas with risk) |
| **Commodity** | Display areas of a specific commodity group |
| **Supplier** | Display areas of a specific supplier |
| **Risk mitigation** | Filter areas by mitigation state (risk mitigated / open risks) |
A **text search** is also available to find areas directly.
## Plot Status
Each plot on the map has an analysis status that is highlighted by color:
| Status | Description |
| ------------------------- | ---------------------------------------------------------------------------------- |
| **No deforestation risk** | Satellite analysis confirms: no deforestation after the cut-off date (31 Dec 2020) |
| **Deforestation risk** | The analysis detected potential deforestation or degradation |
| **Analysis pending** | The plot has been submitted; the satellite analysis is still running |
| **Not EUDR-relevant** | The plot is assigned to a non-EUDR-relevant article |
| **Review pending** | A risk mitigation has been submitted and is awaiting review |
| **Risk mitigated** | A risk was detected but successfully resolved through evidence |
## Plot Details (Sidebar)
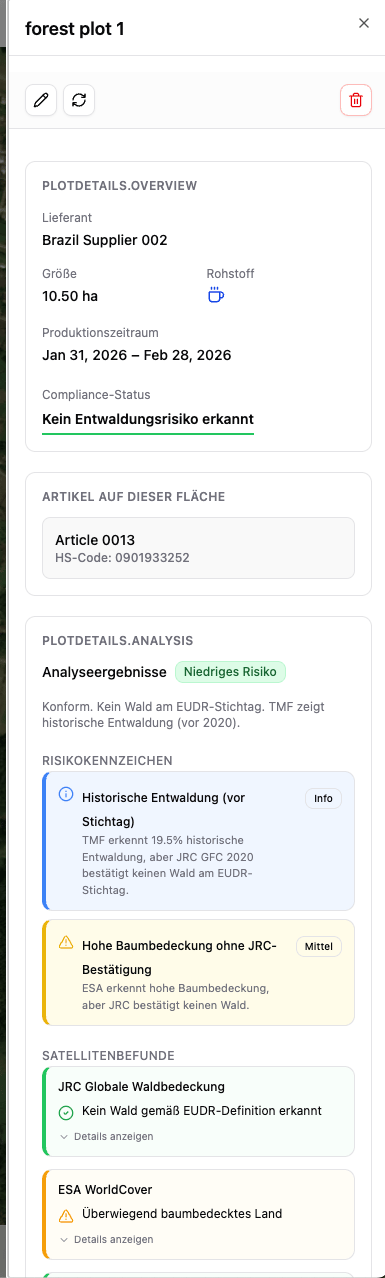
Click a plot on the map or in the sidebar to open the detail panel.
## Filters
Using the filter bar, you can narrow down the displayed areas:
| Filter | Description |
| ------------------- | -------------------------------------------------------------- |
| **Status** | Filter by compliance status (e.g. only areas with risk) |
| **Commodity** | Display areas of a specific commodity group |
| **Supplier** | Display areas of a specific supplier |
| **Risk mitigation** | Filter areas by mitigation state (risk mitigated / open risks) |
A **text search** is also available to find areas directly.
## Plot Status
Each plot on the map has an analysis status that is highlighted by color:
| Status | Description |
| ------------------------- | ---------------------------------------------------------------------------------- |
| **No deforestation risk** | Satellite analysis confirms: no deforestation after the cut-off date (31 Dec 2020) |
| **Deforestation risk** | The analysis detected potential deforestation or degradation |
| **Analysis pending** | The plot has been submitted; the satellite analysis is still running |
| **Not EUDR-relevant** | The plot is assigned to a non-EUDR-relevant article |
| **Review pending** | A risk mitigation has been submitted and is awaiting review |
| **Risk mitigated** | A risk was detected but successfully resolved through evidence |
## Plot Details (Sidebar)
Click a plot on the map or in the sidebar to open the detail panel.
 ### Master Data
* **Plot name** — Designation of the production area
* **Plot size** — Size in hectares (ha)
* **GPS coordinates** — Latitude and longitude (decimal degrees)
* **Country** — Country of the production area
* **Associated articles** — Which articles are produced on this plot
* **Associated supplier** — Which supplier reported this plot
### Satellite Analysis Results
The detail view shows the results of all satellite data sources used:
| Data source | Analysis | Possible results |
| ------------------------------- | ----------------------------------- | ------------------------------------------------------------- |
| **ESA WorldCover** | Land cover classification | Cropland, urban area, water, tree cover, shrubland, grassland |
| **JRC Global Forest Cover** | Forest type detection | Primary forest, natural forest, plantation forest |
| **PALSAR Radar** | Radar-based forest change detection | Low / Medium / High risk |
| **TMF (Tropical Moist Forest)** | Tropical forest monitoring | Undisturbed, Degraded, Plantation, Regrowth, Deforested |
### Additional Checks
* **Agroforestry detection** — Identifies mixed agricultural-forestry land use patterns
* **Plausibility checks** — Detects overlaps with urban areas, bodies of water, and other anomalies
### Risk Flags
If risks have been detected, they are listed as individual flags in the detail view. For each open risk flag, the **"Mitigate"** action is available — see [Risk Remediation](/en/eudr/datensammlung/risiko-behebung) for details on the mitigation process.
## Actions on the Map
### Draw a Plot
Click the **drawing tool** in the map bar.
Place points on the map to define the boundaries of the production area. Click the starting point to close the polygon.
Enter the plot name, the commodity group, and the production country.
After saving, the satellite analysis for the new plot is started automatically.
### Upload GeoJSON
Import prepared geodata as a `.geojson` file:
* Supported geometry types: **Polygon** and **MultiPolygon**
* Supported GeoJSON types: **Feature** and **FeatureCollection**
* Properties from the file are automatically adopted as plot metadata
For larger or mixed files, the dedicated [Plot Import & Review Workflow](/en/eudr/datensammlung/parzellenimport-pruefung) is usually recommended today, as it provides mapping, precision checks, and an issue-list export before the final import.
### Additional Actions
* **Edit boundaries** — Drag the vertices of an existing plot to adjust its boundaries
* **Delete a plot** — Remove a plot via the context menu (with confirmation dialog)
* **Address search** — Search for an address or a place to quickly navigate to the right position on the map
Use the map view for a quick visual overview of how your supply chain is distributed and to identify risk areas. Combine the **Status** filter with the map view to geographically locate affected areas.
### Master Data
* **Plot name** — Designation of the production area
* **Plot size** — Size in hectares (ha)
* **GPS coordinates** — Latitude and longitude (decimal degrees)
* **Country** — Country of the production area
* **Associated articles** — Which articles are produced on this plot
* **Associated supplier** — Which supplier reported this plot
### Satellite Analysis Results
The detail view shows the results of all satellite data sources used:
| Data source | Analysis | Possible results |
| ------------------------------- | ----------------------------------- | ------------------------------------------------------------- |
| **ESA WorldCover** | Land cover classification | Cropland, urban area, water, tree cover, shrubland, grassland |
| **JRC Global Forest Cover** | Forest type detection | Primary forest, natural forest, plantation forest |
| **PALSAR Radar** | Radar-based forest change detection | Low / Medium / High risk |
| **TMF (Tropical Moist Forest)** | Tropical forest monitoring | Undisturbed, Degraded, Plantation, Regrowth, Deforested |
### Additional Checks
* **Agroforestry detection** — Identifies mixed agricultural-forestry land use patterns
* **Plausibility checks** — Detects overlaps with urban areas, bodies of water, and other anomalies
### Risk Flags
If risks have been detected, they are listed as individual flags in the detail view. For each open risk flag, the **"Mitigate"** action is available — see [Risk Remediation](/en/eudr/datensammlung/risiko-behebung) for details on the mitigation process.
## Actions on the Map
### Draw a Plot
Click the **drawing tool** in the map bar.
Place points on the map to define the boundaries of the production area. Click the starting point to close the polygon.
Enter the plot name, the commodity group, and the production country.
After saving, the satellite analysis for the new plot is started automatically.
### Upload GeoJSON
Import prepared geodata as a `.geojson` file:
* Supported geometry types: **Polygon** and **MultiPolygon**
* Supported GeoJSON types: **Feature** and **FeatureCollection**
* Properties from the file are automatically adopted as plot metadata
For larger or mixed files, the dedicated [Plot Import & Review Workflow](/en/eudr/datensammlung/parzellenimport-pruefung) is usually recommended today, as it provides mapping, precision checks, and an issue-list export before the final import.
### Additional Actions
* **Edit boundaries** — Drag the vertices of an existing plot to adjust its boundaries
* **Delete a plot** — Remove a plot via the context menu (with confirmation dialog)
* **Address search** — Search for an address or a place to quickly navigate to the right position on the map
Use the map view for a quick visual overview of how your supply chain is distributed and to identify risk areas. Combine the **Status** filter with the map view to geographically locate affected areas.