> ## Documentation Index
> Fetch the complete documentation index at: https://help.polygon-one.com/llms.txt
> Use this file to discover all available pages before exploring further.
# Manage Plots
> Manage, filter, and analyze production plots in the table view
## Overview
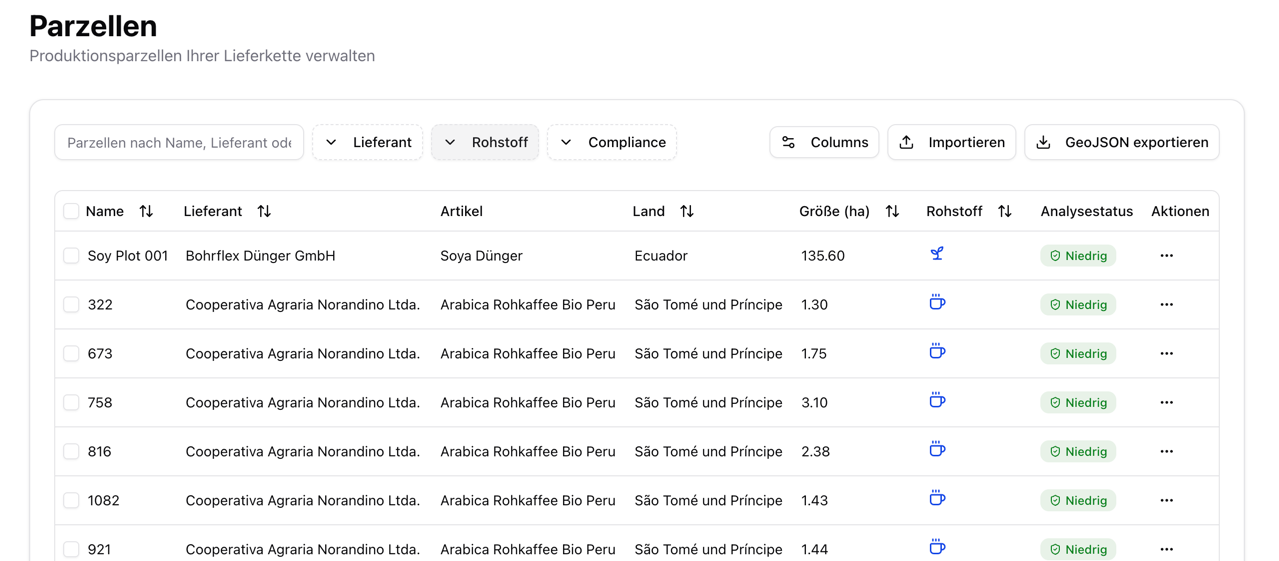
The **plot view** provides a tabular overview of all production areas captured across your supply chain. Unlike the [map view](/en/eudr/optional/karte), here you can filter and sort plots, edit them in bulk, view the analysis status in detail, and track the import state of problematic plots.
 ## Import & Review Workflow
New plots are usually prepared today via the **staged plot import**. There, you check the mapping, precision, country plausibility, and problematic rows before the final import.
Import CSV, Excel, and GeoJSON files with preview, precision checks, and issue-list export.
## Table Columns
| Column | Description |
| --------------------- | ------------------------------------------------ |
| **Name** | Designation of the plot (sortable) |
| **Supplier** | Associated supplier |
| **Article** | Linked articles (displayed as badges) |
| **Country** | Production country |
| **Size (ha)** | Plot size in hectares |
| **Commodity** | Commodity group (e.g. coffee, cocoa, wood) |
| **Analysis status** | Result of the satellite analysis with risk level |
| **Production period** | Start and end date of production |
## Analysis Status
The analysis status shows the current state of the satellite evaluation:
### Processing Status
| Status | Description |
| ----------------------- | --------------------------------------------------- |
| **Pending** | Analysis has not yet started |
| **Analysis running...** | Satellite evaluation is currently being performed |
| **Analysis failed** | The evaluation could not be completed |
| **Excluded** | The plot is assigned to a non-EUDR-relevant article |
### Risk Level (after completion)
| Risk level | Color | Description |
| ---------- | ------ | ---------------------------------------------------------- |
| **Low** | Green | No deforestation indicators detected |
| **Medium** | Yellow | Individual indicators detected, further review recommended |
| **High** | Red | Clear deforestation or degradation indicators |
## Import & Review Workflow
New plots are usually prepared today via the **staged plot import**. There, you check the mapping, precision, country plausibility, and problematic rows before the final import.
Import CSV, Excel, and GeoJSON files with preview, precision checks, and issue-list export.
## Table Columns
| Column | Description |
| --------------------- | ------------------------------------------------ |
| **Name** | Designation of the plot (sortable) |
| **Supplier** | Associated supplier |
| **Article** | Linked articles (displayed as badges) |
| **Country** | Production country |
| **Size (ha)** | Plot size in hectares |
| **Commodity** | Commodity group (e.g. coffee, cocoa, wood) |
| **Analysis status** | Result of the satellite analysis with risk level |
| **Production period** | Start and end date of production |
## Analysis Status
The analysis status shows the current state of the satellite evaluation:
### Processing Status
| Status | Description |
| ----------------------- | --------------------------------------------------- |
| **Pending** | Analysis has not yet started |
| **Analysis running...** | Satellite evaluation is currently being performed |
| **Analysis failed** | The evaluation could not be completed |
| **Excluded** | The plot is assigned to a non-EUDR-relevant article |
### Risk Level (after completion)
| Risk level | Color | Description |
| ---------- | ------ | ---------------------------------------------------------- |
| **Low** | Green | No deforestation indicators detected |
| **Medium** | Yellow | Individual indicators detected, further review recommended |
| **High** | Red | Clear deforestation or degradation indicators |
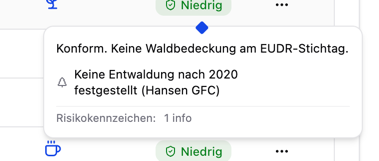 Hover over the analysis status to see a **detail tooltip** with the following information:
* Summary of the analysis
* Hansen forest loss after 2020 (percent)
* Breakdown of the risk flags (High / Medium / Info)
* Mitigation status (if applicable)
## Filters
| Filter | Description |
| -------------------- | ----------------------------------------------------------------------------------- |
| **Text search** | Searches name, supplier, and article |
| **Supplier** | Filter by the associated supplier |
| **Commodity group** | Filter by commodity |
| **Compliance** | Filter by compliance status (e.g. only plots with risk) |
| **Precision issues** | Specifically shows plots with import precision that requires confirmation or review |
## Bulk Actions
Select one or more plots using the checkboxes to perform the following actions:
Exports import issues or precision cases for external cleanup and coordination.
Exports the selected plots as a GeoJSON file for use in GIS systems.
Update articles, production data, or producer names for multiple plots at once.
Restart the satellite analysis for selected plots — e.g. after a boundary correction.
Remove selected plots (with confirmation dialog).
## Individual Actions
The **action menu** (three dots) in each row provides the following options:
* **Show on map** — Switch directly to the [map view](/en/eudr/optional/karte) of the plot
* **Edit** — Adjust the plot name, production data, producer, and geometry
* **Download report** — Download the compliance report for this plot
* **Delete** — Remove the plot
**Re-analyze** is a bulk action: select one or more plots using the checkboxes to use it.
Hover over the analysis status to see a **detail tooltip** with the following information:
* Summary of the analysis
* Hansen forest loss after 2020 (percent)
* Breakdown of the risk flags (High / Medium / Info)
* Mitigation status (if applicable)
## Filters
| Filter | Description |
| -------------------- | ----------------------------------------------------------------------------------- |
| **Text search** | Searches name, supplier, and article |
| **Supplier** | Filter by the associated supplier |
| **Commodity group** | Filter by commodity |
| **Compliance** | Filter by compliance status (e.g. only plots with risk) |
| **Precision issues** | Specifically shows plots with import precision that requires confirmation or review |
## Bulk Actions
Select one or more plots using the checkboxes to perform the following actions:
Exports import issues or precision cases for external cleanup and coordination.
Exports the selected plots as a GeoJSON file for use in GIS systems.
Update articles, production data, or producer names for multiple plots at once.
Restart the satellite analysis for selected plots — e.g. after a boundary correction.
Remove selected plots (with confirmation dialog).
## Individual Actions
The **action menu** (three dots) in each row provides the following options:
* **Show on map** — Switch directly to the [map view](/en/eudr/optional/karte) of the plot
* **Edit** — Adjust the plot name, production data, producer, and geometry
* **Download report** — Download the compliance report for this plot
* **Delete** — Remove the plot
**Re-analyze** is a bulk action: select one or more plots using the checkboxes to use it.
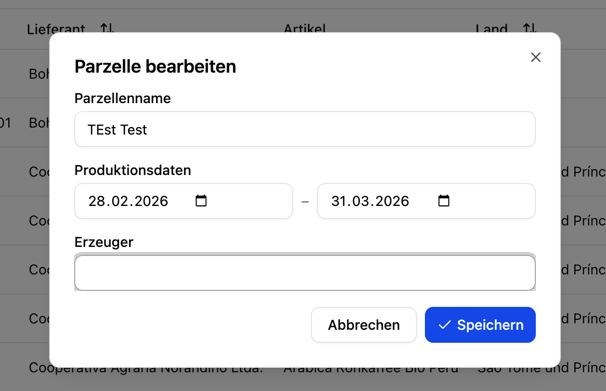 The plot view is especially well suited for quickly identifying all plots with a deforestation risk after data collection — use the **Compliance** filter and start the [Risk Remediation](/en/eudr/datensammlung/risiko-behebung) from there.