

Overview
The plot view provides a tabular overview of all production areas captured across your supply chain. Unlike the map view, here you can filter and sort plots, edit them in bulk, view the analysis status in detail, and track the import state of problematic plots.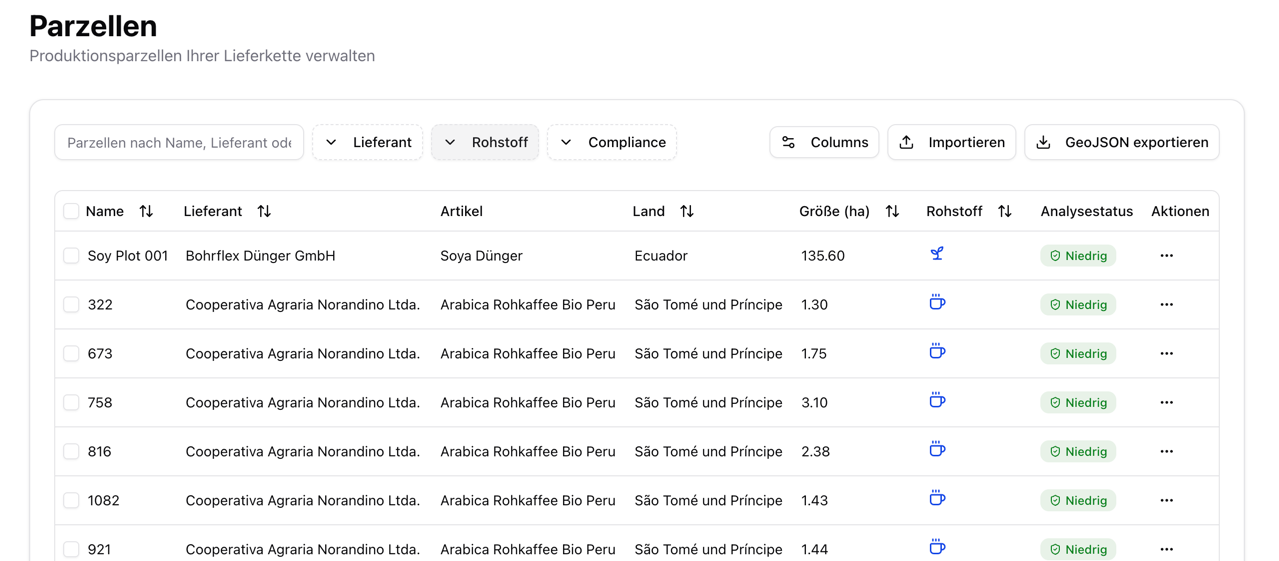
Plot overview with filters and analysis status
Import & Review Workflow
New plots are usually prepared today via the staged plot import. There, you check the mapping, precision, country plausibility, and problematic rows before the final import.Plot Import & Review Workflow
Import CSV, Excel, and GeoJSON files with preview, precision checks, and issue-list export.
Table Columns
Analysis Status
The analysis status shows the current state of the satellite evaluation:Processing Status
Risk Level (after completion)
If a plot was recorded only as a point (without a polygon boundary), the analysis is based on a size-derived screening area around that point. In this case a high risk is classified as Medium and flagged accordingly until a real polygon boundary or supplementary evidence is provided.
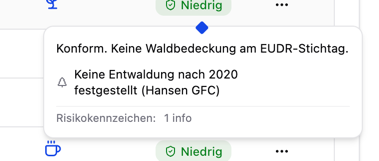
Analysis status with risk flags and Hansen forest loss
- Summary of the analysis
- Hansen forest loss after 2020 (percent)
- Breakdown of the risk flags (High / Medium / Info)
- Mitigation status (if applicable)
Filters
Bulk Actions
Select one or more plots using the checkboxes to perform the following actions:Export issue list
Exports import issues or precision cases for external cleanup and coordination.
Export GeoJSON
Exports the selected plots as a GeoJSON file for use in GIS systems.
Edit plots
Update articles, production data, or producer names for multiple plots at once.
Re-analyze
Restart the satellite analysis for selected plots — e.g. after a boundary correction.
Delete plots
Remove selected plots (with confirmation dialog).
Individual Actions
The action menu (three dots) in each row provides the following options:- Show on map — Switch directly to the map view of the plot
- Edit — Adjust the plot name, production data, producer, and geometry
- Download report — Download the compliance report for this plot
- Delete — Remove the plot
Re-analyze is a bulk action: select one or more plots using the checkboxes to use it.
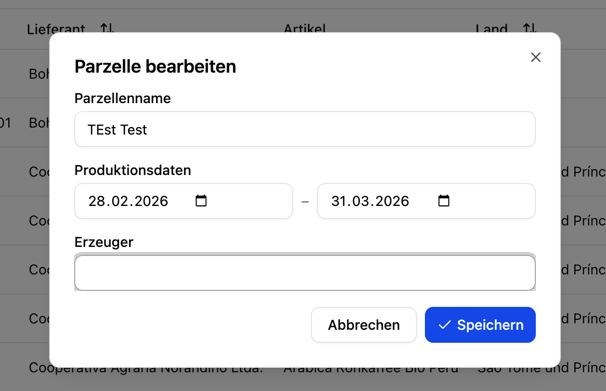
Edit plot dialog